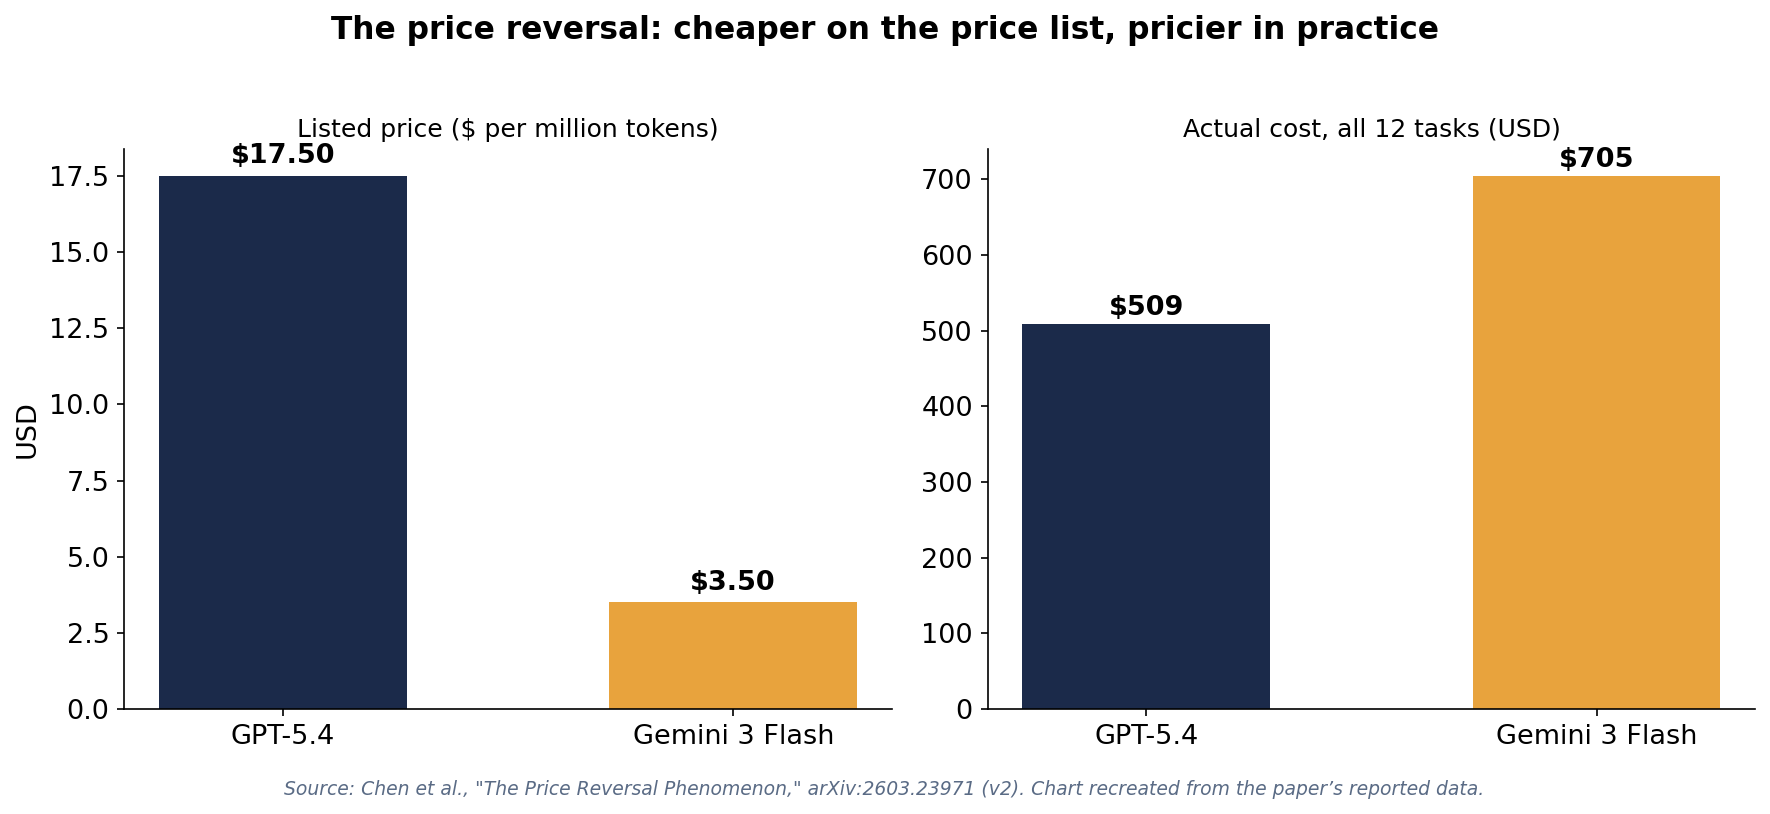
Gemini 3 Flash lists at $3.50 per million tokens. GPT-5.4 lists at $17.50, five times more. The lower cost seems like a no-brainer.
But run them both across twelve real workloads and the Flash costs $705 to GPT-5.4’s $509. The “cheap” model is 38% more expensive.
This isn’t a rounding error. It’s the headline finding of a March 2026 study from researchers at Stanford, CMU, Berkeley, and Microsoft Research: in 32% of head-to-head model comparisons, the lower-listed-price model incurred the higher actual cost, with the gap reaching 28×. And it’s the empirical founding case for a discipline every enterprise now needs: tokenomics: maximizing the value of every dollar you spend on tokens.
Tokenomics: FinOps grew up, and so must you
Cloud had the same adolescence. Early on, everyone compared instance prices; then the bill arrived and FinOps was born: the discipline of turning cloud spend into a managed, attributed, optimized number. Tokenomics is FinOps for the AI bill. Same job: know what each dollar bought you, and stop paying for what it didn’t.
The study shows why the old habit of comparing per-token list prices is broken for reasoning models. Unit price was a fine proxy when output was the product. It isn’t anymore, because most of what you pay for is never shown to you.
The hidden line item: thinking tokens
Reasoning models produce two kinds of output: the answer you see, and the thinking tokens you don’t, billed at full output rates. The researchers decomposed every bill by token type and found thinking tokens dominate total cost for nearly all models. Then they measured the variance: on the same query, one model can burn 900% more thinking tokens than another. In agentic tasks, one model needed 10× more environment interaction turns.
A concrete case: given the same competition-math problem, two models reached the same correct answer with comparable prompt and answer sizes. One used 562 thinking tokens. The other used over 11,000. That 20× gap in invisible tokens produced a 2.5× higher bill, and it came from the cheaper model.
To prove causation rather than correlation, the researchers ran an ablation: zero out thinking-token costs and recompute every ranking. Reversals fell 70%, and the correlation between price ranking and cost ranking jumped from 0.563 to 0.873. Thinking tokens aren’t just associated with the reversal. They are the reversal.
The unintuitive part: simple questions cost the most
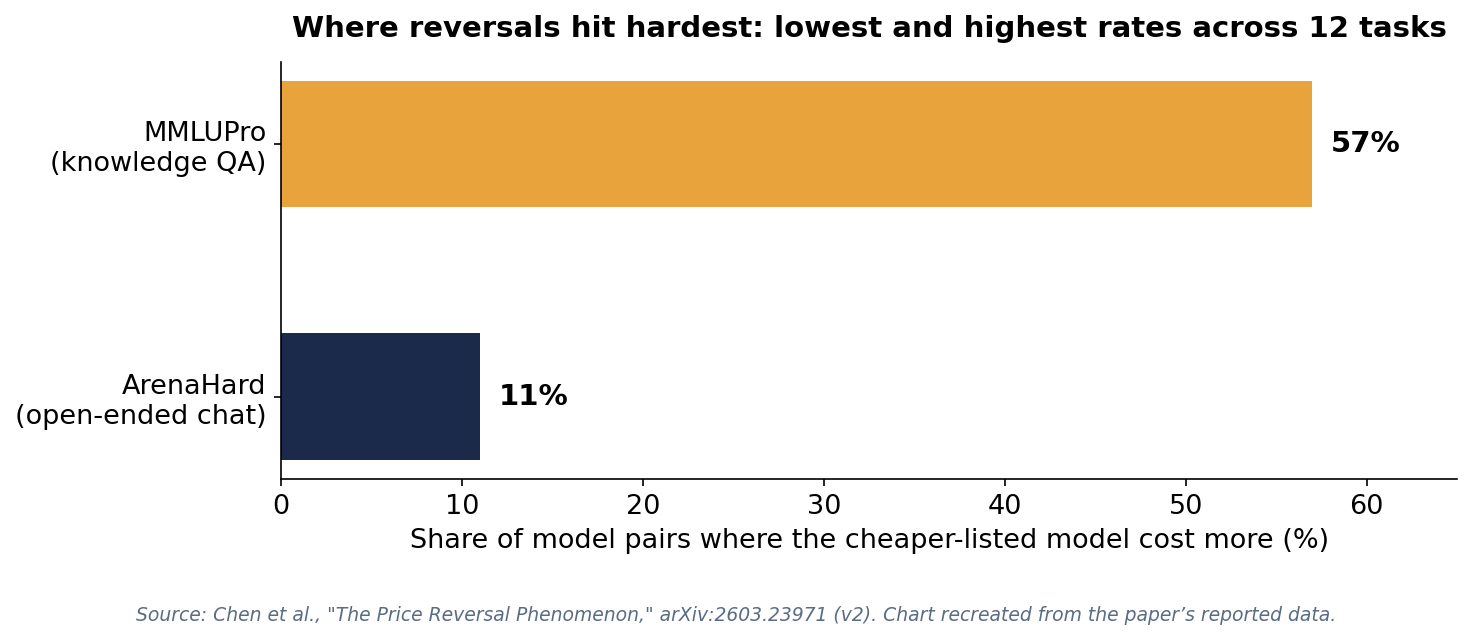
Reversal rates ranged from 11% on open-ended chat to 57% on MMLUPro (a 3,000-question multiple-choice test of professional knowledge). The task where models think the least productively is where the inefficiency peaks.
The mechanism is a ratio problem. MMLUPro answers are a single letter, nearly zero visible output, yet one model burned 71 million thinking tokens across 3,000 questions. Roughly 24,000 thinking tokens per question, to output “C.”
When the visible answer is tiny and the hidden deliberation is enormous, thinking tokens are the bill.
The tokenomics lesson: cost inefficiency peaks where output looks cheapest. If your workload is classification, extraction, or short-form QA, the highest-volume enterprise workloads, the price list is at its most misleading.
You can’t even predict it
It gets worse. The researchers re-ran identical queries six times each, on different days, with default parameters. The same query varied up to 9.7× in thinking tokens between runs. Not across models: the same model, the same prompt.
That’s an irreducible noise floor. No predictor, however sophisticated, can forecast a bill that swings tenfold on identical input. Their baselines all failed on high-variance models, including a predictor that estimated each bill from the bills of similar questions it had seen before. Budgeting per query is, strictly speaking, impossible; you can only manage distributions.
The tokenomics playbook
Five things I’d take to the architecture review:
1. Audit on your workload, not the price list. Run your representative queries through candidate models and meter the actual bills. The study found no model cheapest everywhere; rankings flip by task. Your workload is the only benchmark that matters.
2. Demand per-request cost breakdowns. Thinking vs. generation vs. tool-turn tokens should be separate line items, the way compute vs. storage vs. egress are. A provider quoting per-token prices without surfacing thinking overhead is quoting half the bill.
3. Treat reasoning effort as a cost control. Reasoning budgets and effort settings are the tokenomics equivalent of rightsizing instances. Don’t run max deliberation on classification workloads.
4. Price the outcome, not the token. The metric that matters is cost-of-pass: dollars per correct answer, not dollars per million tokens. A model that answers in one short turn beats a cheaper-per-token model that needs ten.
5. Monitor like FinOps. Per-request cost attribution, anomaly detection on thinking-token spikes, budgets with alerts. The 9.7× variance means you can’t predict spend. But you can watch it, and you can cap it.
The bottom line
Tokenomics starts from a simple premise: a token is not a token. A thinking token you never see, billed at output rates, varying 900% between models and 9.7× between identical runs, has destroyed the unit price as a decision tool.
The enterprises that win the AI cost game won’t be the ones that picked the cheapest model. They’ll be the ones that metered the real one.
Source: Lingjiao Chen et al., “The Price Reversal Phenomenon: When Cheaper Reasoning Models Cost More,” arXiv:2603.23971 (v2, May 2026). 8 models, 12 tasks, ~11,900 queries. All figures above are the authors’ reported results.

